Clik here to view.

As Web page design and layout has gotten more sophisticated (really it’s mostly just more complicated) it seems like less people are taking the route of just viewing the HTML source of a Web page and instead moving into more sophisticated development and debugging environments. This means that what you’re really seeking is not a “pop open a new page with the HTML source” feature in the new Microsoft Edge web browser on your Windows computer, but a “open up this page in the debugger” feature. Which you probably didn’t realize. Image may be NSFW.
Clik here to view.
Worse is that the debugger is pretty darn complicated and looks inspired by the great debugging environment included with Firefox, yet another Web browser. Sadly, while you might want that pop-up source window, that’s not what you’re going to get in Edge, at least by default.
Let’s have a look how to at least enable the option of viewing the source, whatever that looks like!
I’ll start on, well, this site’s home page:
Image may be NSFW.
Clik here to view.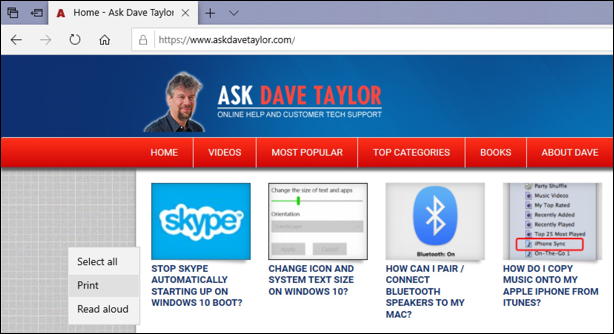
This is just the top left of the page because I want to highlight the context menu that’s appeared because I right clicked on the background of the page. See it on the left? It has three options: “Select all”, “Print”, and “Read aloud”.
Once we enable it, View Source will appear on this menu too. To accomplish that, click on the “•••” on the top right to bring up the main menu, then look for “Developer Tools” on the “More tools” option, as shown:
Image may be NSFW.
Clik here to view.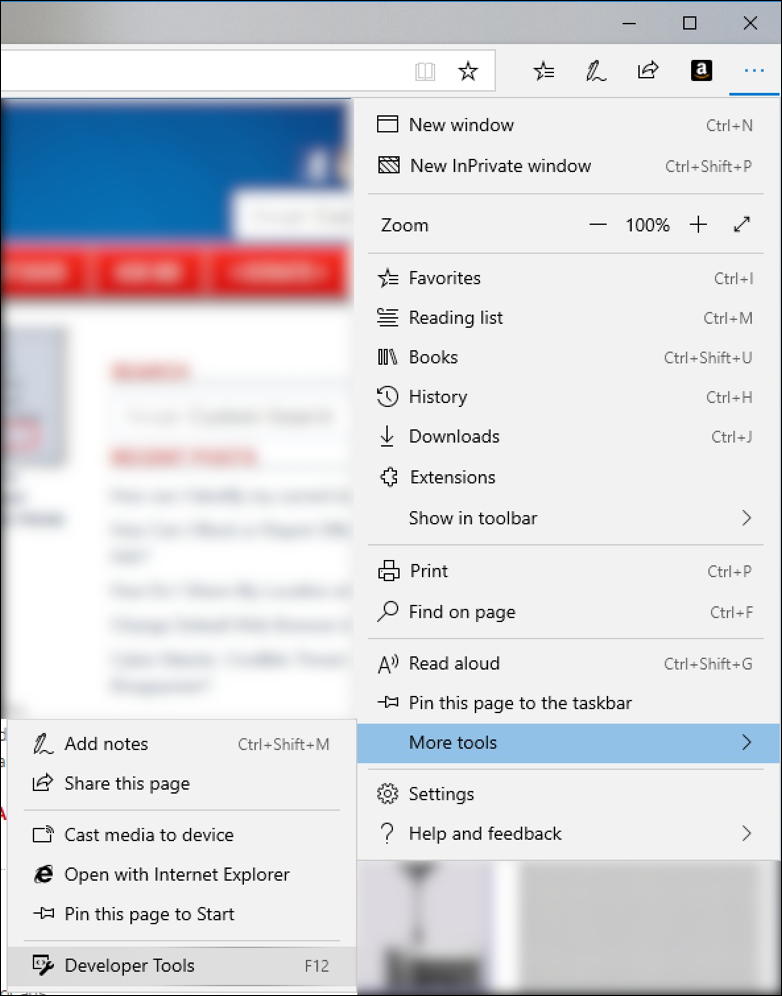
This brings up the debugger, but even if you immediately close it, this tells Edge that you want to have access to Developer Tools in the future too. Which produces this on the very bottom of the window:
Image may be NSFW.
Clik here to view.
Mission accomplished. That’s the trick and now when you right-click the context menu has the two new options:
Image may be NSFW.
Clik here to view.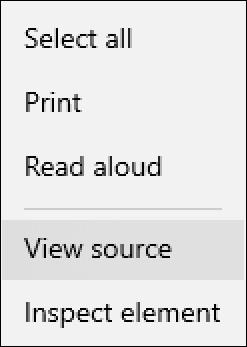
As I warned, however, when you choose “View source” you get it within the debugging environment, so it’s a bit more complicated than I imagine you’re expecting:
Image may be NSFW.
Clik here to view.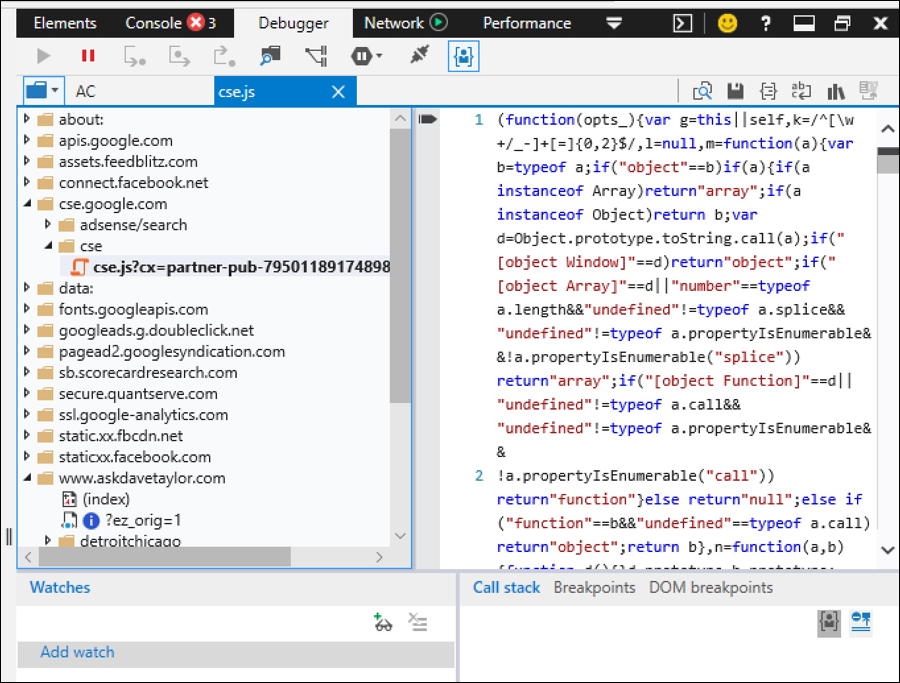
The right pane here shows the HTML source, though at the top of the pages here on AskDaveTaylor they’re more about code to accomplish various tasks as you can see. Biggest thing to look for are the red “X” symbol on the “Console” tab (I have three errors) and the “X” all the way to the right of this new section which closes up all these windows and gets you back to a normal browsing experience.
That’s it. Hope it helps you with your HTML study and I encourage you to check out this basic tutorial on how to use the debugging environment in Microsoft Edge too.
Pro Tip: I’ve been writing about HTML for many years, including writing a few books on the subject! Please check out our HTML help pages here on the site, and don’t miss our extensive Windows help too.
The post How can I view HTML page source in Microsoft Edge? originally appeared on Ask Dave Taylor.
